November 26, 2025
Unlocking Manufacturing Productivity with Overall Equipment Effectiveness (OEE)

Manufacturing excellence requires more than just running equipment, it demands truly productive manufacturing time where every minute contributes to quality output.
Overall equipment effectiveness (OEE) serves as the ultimate key performance indicator for measuring how efficiently manufacturing equipment converts planned production time into valuable products.
This comprehensive guide explores everything you need to know about measuring OEE, from basic calculations to advanced implementation strategies that drive continuous improvement in modern manufacturing.
Understanding and implementing overall equipment effectiveness oee transforms reactive maintenance approaches into proactive strategies that systematically improve manufacturing productivity while eliminating waste. Whether you’re just beginning your journey or looking to optimize existing systems, this guide provides the practical insights needed to achieve world class manufacturing performance.
What is Overall Equipment Effectiveness (OEE)?
Overall Equipment Effectiveness is a manufacturing best practice metric that measures equipment utilization against its full potential during scheduled production time. At its core, OEE reveals the percentage of manufacturing time that is truly productive - meaning the equipment operates at maximum possible speed while producing good units that meet quality standards.
A perfect OEE score of 100% represents the theoretical ideal where manufacturing equipment produces only good parts at maximum speed with zero equipment downtime. In reality, most companies achieve OEE scores between 40-85%, making it both a benchmark for current performance and a baseline for identifying underlying losses in the production process.

OEE functions as both a diagnostic tool and performance score by combining three critical factors into a single percentage value:
- Availability - measures equipment uptime during planned production
- Performance - compares actual speed to maximum possible speed
- Quality - tracks the ratio of good units produced to total units
The power of measuring OEE lies in its ability to identify specific areas for improvement efforts while providing important insights into the underlying causes of manufacturing inefficiencies. Rather than simply tracking overall equipment performance, OEE data enables targeted interventions that reduce downtime, improve quality, and optimize production speed.
This effective metric serves as the foundation for data-driven decision making in manufacturing processes, helping teams track improvements systematically and focus resources where they’ll have the greatest impact on manufacturing productivity.
OEE Calculation Methods
Understanding how to calculate OEE properly forms the foundation of any successful implementation. There are two primary approaches to oee calculation, each offering different levels of insight into your manufacturing process performance.
Simple Calculation Method
The straightforward approach uses this oee formula: OEE = (Good Count × Ideal Cycle Time) / Planned Production Time
This method requires three key data points:
- Good Count - the number of quality parts produced that meet standards
- Ideal Cycle Time - the fastest possible manufacturing time per piece under optimal conditions
- Planned Production Time - simply planned production time scheduled for manufacturing
For example, if equipment produces 400 good units in an 8-hour shift with an ideal cycle time of 1.2 minutes per unit: OEE = (400 × 1.2) ÷ 480 = 480 ÷ 480 = 100%
Preferred Three-Factor Method
The more comprehensive approach calculates OEE by multiplying good count across three performance dimensions: OEE = Availability × Performance × Quality
While mathematically equivalent to the simple method, this preferred calculation provides deeper insights into specific improvement opportunities by isolating availability performance and quality factors separately. This granular view enables targeted improvement efforts focused on the most significant underlying losses.
Availability Calculation
Availability measures equipment uptime during planned production and is calculated based on: Availability = Run Time / Planned Production Time
Where Run Time equals Planned Production Time minus all Stop Time from equipment failures, unplanned stops, material shortages, and changeover activities.
Key availability losses include:
- Equipment failures and breakdowns
- Setup and changeover time between product runs
- Material shortages that halt production
- Planned stops for routine maintenance
For instance, if equipment is scheduled for 480 minutes but experiences 60 minutes of downtime: Availability = (480 - 60) ÷ 480 = 87.5%
Performance Calculation
Performance measures whether equipment runs at its highest possible speed during productive manufacturing time: Performance = (Ideal Cycle Time × Total Count) / Run Time
This metric captures performance losses from slow cycles, minor stops, and reduced speed operation that prevent equipment from reaching maximum speed. The calculation focuses specifically on running production time when output is being processed.
Using our previous example with 420 minutes of run time producing 350 total units: Performance = (1.2 × 350) ÷ 420 = 420 ÷ 420 = 100%
Quality Calculation
The quality score measures the proportion of production that meets quality standards: Quality = Good Count / Total Count
Quality losses stem from defective parts, rework requirements, and scrap that doesn’t contribute to truly productive manufacturing time. Only good units produced that pass quality inspection contribute to effective manufacturing output.
If 350 total units were produced with 330 meeting specifications: Quality = 330 ÷ 350 = 94.3%
Combined OEE = 87.5% × 100% × 94.3% = 82.5%
OEE Benchmarks and Industry Standards
Understanding industry benchmarks helps contextualize your oee metric performance and set realistic improvement targets. However, the commonly cited “85% is world class” benchmark oversimplifies the complexity of different manufacturing environments and should be applied cautiously.
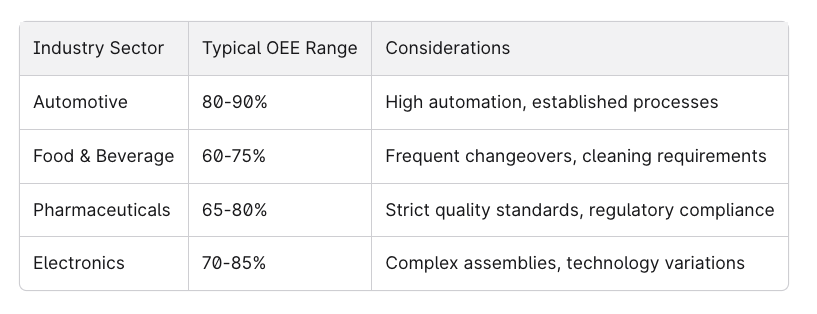
The reality is that world class performance varies significantly by industry context, equipment type, and operational requirements. A pharmaceutical manufacturer achieving 75% OEE while maintaining stringent quality standards may demonstrate superior performance compared to an automotive plant at 85% with simpler processes.

International standards provide more nuanced guidance:
- ISO 22400-2:2014 establishes key performance indicator definitions for manufacturing operations management
- VDI 3423:2011-08 provides German engineering standards for OEE measurement methodology
Rather than targeting arbitrary benchmarks, successful companies focus on continuous improvement trends and company-specific customization of OEE metrics that reflect their unique manufacturing applications and business objectives.
OEE in Lean Manufacturing and Continuous Improvement
Overall equipment effectiveness serves as a cornerstone key performance indicator in lean manufacturing initiatives, directly supporting the systematic elimination of waste throughout the production process. The metric aligns perfectly with lean principles by identifying and quantifying the eight wastes that reduce manufacturing efficiency.
OEE reveals six primary types of losses that prevent optimal manufacturing performance:
Availability Losses:
- Equipment failures and breakdowns
- Setup and changeover time between products
Performance Losses:
- Minor stops and equipment idling
- Slow cycles and reduced speed operation
Quality Losses:
- Defective products requiring rework
- Scrap that doesn’t meet quality standards
This framework integrates seamlessly with Total Productive Maintenance (TPM) programs, where OEE data guides predictive maintenance strategies and equipment reliability improvements. Manufacturing teams use oee data to prioritize maintenance activities, optimize changeover procedures, and implement standardized processes that reduce variability.
Total Effective Equipment Performance (TEEP)
While OEE measures effectiveness during planned production time, Total Effective Equipment Performance (TEEP) provides a broader perspective by measuring performance against total calendar hours rather than simply planned production time.
TEEP = Loading Factor × OEE
Where Loading Factor = Planned Production Time / Available Time
TEEP calculation includes all available time—24 hours per day, 365 days per year—providing a complete picture of equipment utilization for capacity planning and capital investment decisions. A 100% TEEP score means equipment runs at 100% OEE continuously, 24/7, 365 days annually.
This expanded metric proves particularly valuable for:
- Evaluating capacity utilization across multiple shifts
- Making data-driven capital investment decisions
- Comparing equipment effectiveness across different operational schedules
- Identifying opportunities to extend productive manufacturing time
Data Collection Methods for OEE
Accurate OEE measurement depends on reliable data processing from disparate data sources throughout the manufacturing process. The method chosen for data collection significantly impacts both the accuracy of results and the sustainability of improvement efforts.
Manual Data Collection
Operators manually record production counts, downtime events, and quality metrics using paper forms or digital tablets. This approach offers several advantages:
- High operator engagement and awareness of OEE concepts
- Detailed context about downtime causes and operational issues
- Lower initial technology investment requirements
- Flexibility in capturing unique manufacturing situations
However, manual collection faces challenges with accuracy, time consumption, and consistency across different shifts and operators. The process requires extensive training and ongoing discipline to maintain data quality.
Semi-Automatic Data Collection
This hybrid approach combines automated system data with operator input for context and verification. Manufacturing execution systems (MES) automatically capture production counts and cycle times, while operators provide downtime reasons and quality assessments.
Semi-automatic systems balance automation benefits with human insight, typically improving data accuracy while maintaining operational awareness. This method works particularly well during initial OEE implementations before full automation.
Automatic Data Collection
Advanced manufacturing environments leverage specialized software and Industrial Internet of Things (IoT) devices to capture real time data automatically. Sensors monitor equipment status, production counts, cycle times, and quality metrics without manual intervention.

Automatic collection offers:
- Continuous monitoring without operator burden
- Consistent data accuracy across all shifts
- Real-time alerts and performance tracking
- Integration with predictive maintenance systems
- Comprehensive historical data for trend analysis
The challenge lies in ensuring sensors accurately reflect actual manufacturing events and connecting disparate data sources into cohesive OEE reporting systems. With Matix, it is possible to seamlessly integrate these data streams and achieve the desired outcome of precise, real-time overall equipment effectiveness measurement.
Common OEE Implementation Challenges
Successfully implementing OEE measurement requires navigating several common pitfalls that can undermine accuracy and adoption. Understanding these challenges helps organizations develop more effective implementation strategies.
Terminology and Measurement Confusion
Many organizations struggle with the distinction between “effectiveness” and “efficiency” when implementing OEE. Equipment effectiveness measures output against potential during planned production time, while efficiency typically compares input resources to output results. This confusion can lead to incorrect calculations and misaligned improvement efforts.
Quality Detection and Timing Issues
Quality loss measurement becomes complex when defects are discovered downstream from the equipment that caused them. For example, defective parts identified during final inspection may have originated from earlier manufacturing steps, making it difficult to assign quality losses to the appropriate equipment or process.
Effective OEE implementation requires clear procedures for:
- Attributing quality issues to root cause equipment
- Handling rework and repair activities
- Managing quality data when inspection occurs at different manufacturing stages
Changeover and Maintenance Impact
Organizations frequently struggle with how to handle planned stops for changeovers and preventive maintenance within OEE calculations. These necessary activities reduce availability but are essential for long-term manufacturing performance.
Best practices include:
- Clearly defining planned versus unplanned stops in availability calculations
- Setting appropriate downtime thresholds before events count as stops
- Tracking changeover efficiency as a separate improvement focus
- Balancing OEE optimization with maintenance requirements
Inappropriate Comparisons and Benchmarking
Comparing OEE scores across different machines, products, or manufacturing sites without considering operational context leads to misleading conclusions. A packaging line with frequent product changeovers will naturally have different availability characteristics than a continuous process operation.
Managing Interlinked Equipment
Complex manufacturing lines with interdependent equipment face “starved” and “blocked” conditions where one machine’s performance affects others. Traditional OEE calculation can become misleading when equipment stops not due to its own failures but because of upstream or downstream constraints. Industrial IoT sensors can improve OEE by enabling real-time condition monitoring and proactive response to such constraints.
These situations require modified OEE approaches that account for line interactions and focus on overall system effectiveness rather than individual machine performance.
Modern OEE Applications and Technology Integration
Contemporary manufacturing leverages advanced technologies to enhance traditional OEE measurement and create new opportunities for improvement. These innovations transform OEE from a retrospective reporting tool into a proactive manufacturing intelligence system.
Industrial IoT and Real-Time Monitoring
Industrial Internet of Things (IoT) integration enables continuous, automated data collection that provides real time data on equipment performance without manual intervention. Smart sensors monitor vibration, temperature, pressure, and other parameters that indicate equipment condition and performance trends.
Modern IoT systems offer advanced monitoring capabilities such as those provided by the Matix Sensor Ecosystem for Predictive Maintenance:
- Automatic production counting through machine monitoring
- Real-time equipment status visibility across manufacturing facilities
- Predictive analytics that forecast equipment failures before they occur
- Mobile access to OEE data for immediate decision making
Computer Vision and Quality Automation
Computer vision systems revolutionize quality measurement by automatically inspecting products and identifying defects in real-time. These systems improve quality scores by:
- Eliminating human inspection variability
- Detecting defects that manual inspection might miss
- Providing immediate feedback for process adjustments
- Creating comprehensive quality data for trend analysis
Vision systems integrate seamlessly with OEE calculation systems, automatically updating quality factors as production progresses and enabling immediate response to quality issues.
Predictive Maintenance Integration
Advanced analytics combine OEE data with machine learning algorithms to predict equipment failures and optimize maintenance schedules. These systems analyze patterns in performance degradation, vibration signatures, and operational parameters to forecast when maintenance interventions will be most effective.
Predictive maintenance systems enhance OEE by:
- Reducing unplanned downtime through early failure detection
- Optimizing maintenance timing to minimize production impact
- Extending equipment lifespan through proactive care
- Improving planned stop efficiency through better maintenance planning
Cloud-Based Analytics and Multi-Site Visibility
Cloud-based OEE solutions enable manufacturers to monitor performance across multiple facilities from centralized dashboards. These platforms aggregate data from various sources and provide standardized reporting that facilitates benchmarking and best practice sharing.
Modern analytics platforms offer:
- Automated trend identification and anomaly detection
- Customizable dashboards for different organizational levels
- Integration with enterprise resource planning (ERP) and manufacturing execution systems (MES)
- Advanced reporting that connects OEE performance to business outcomes
Best Practices for OEE Implementation
Successful OEE implementation requires a systematic approach that addresses technology, processes, and culture simultaneously. These proven practices help organizations avoid common pitfalls and achieve sustainable improvements in manufacturing productivity.
Start with Pilot Programs
Begin OEE implementation with pilot programs focused on critical equipment before attempting facility-wide rollout. This approach allows teams to:
- Test data collection methods and validate accuracy
- Develop standard procedures for different equipment types
- Build operator confidence and competence with OEE concepts
- Demonstrate value before requesting broader organizational investment
Pilot programs should focus on equipment where downtime has significant business impact and where data collection can be standardized relatively easily.
Comprehensive Training and Education
Training programs must address both technical aspects of OEE calculation and the cultural changes required for sustained success. Effective training includes:
- Operators: Understanding OEE components, accurate data collection, identifying improvement opportunities
- Maintenance teams: Using OEE data to prioritize activities, understanding equipment effectiveness impact
- Management: Interpreting OEE trends, making resource allocation decisions, supporting improvement initiatives
Training should emphasize OEE as a diagnostic tool for identifying improvement opportunities rather than simply a performance metric for evaluation.
Establish Clear Data Collection Procedures
Standardized procedures ensure consistent, accurate data collection across shifts, operators, and equipment types. These procedures should specify:
- Responsibility assignments for different data collection tasks
- Definitions of downtime categories and quality standards
- Protocols for handling unusual situations or equipment interactions
- Regular calibration and validation of automated systems
Regular Review and Cross-Functional Analysis
OEE data becomes valuable through regular analysis that identifies patterns, trends, and improvement opportunities. Effective review processes include:
- Daily huddles focusing on previous shift OEE performance
- Weekly cross-functional meetings analyzing trends and planning improvements
- Monthly reviews connecting OEE performance to broader business objectives
- Quarterly assessments of improvement program effectiveness
Balance OEE with Other Business Objectives
While OEE optimization delivers significant benefits, it must be balanced with other manufacturing objectives such as cost control, flexibility, and safety. Organizations should:
- Consider total cost impact when pursuing OEE improvements
- Maintain flexibility to respond to customer demand changes
- Ensure improvement efforts don’t compromise safety standards
- Connect OEE improvements to broader business performance metrics
Maximizing Manufacturing Success Through OEE Excellence
Overall equipment effectiveness transforms manufacturing performance by providing a comprehensive framework for measuring and improving equipment utilization. This powerful performance metric reveals the true productive capacity of manufacturing equipment while identifying specific opportunities to reduce downtime, improve quality, and optimize production speed.
The journey from basic OEE measurement to advanced manufacturing intelligence requires commitment to continuous improvement, investment in appropriate technology, and cultural changes that embrace data-driven decision making. Organizations that successfully implement OEE see significant improvements in manufacturing productivity, reduced costs, and enhanced competitive positioning.
The key to OEE success lies in starting with accurate measurement, focusing on underlying causes rather than just scores, and maintaining sustained commitment to eliminating waste throughout your manufacturing process.
Begin your OEE transformation today by identifying critical equipment for pilot implementation, establishing baseline measurements, and building the cross-functional teams needed to turn OEE data into sustained manufacturing excellence.
To see a real-world example, explore this Matix case study showcasing how an international company increased their OEE by 2% by gaining maximum control of their molds and supply chain data.

You might also like
.png)

.png)

MAXIMIZE OEE
Your Tools, Our Technology
Take control of your industrial tools' performance. Our demo will show you how to leverage real-time data, predictive analytics, and comprehensive asset management to minimize downtime and maximize productivity.


“New eyes on your molds production to lead performance towards operational excellence.”

Emanuele Quarin, Digital industrial operations director